Signal Chain Web Tool Development
During the summer of 2023, I completed an internship at Analog Devices in their headquarters in Wilmington, Massachusetts. I worked in the Precision Signal Chain Tools Group within the industrial & multi-market business unit. The group develops web tools for designing and analyzing various types of circuits. The primary tool I worked on was the noise tool (will be renamed soon), but I also worked on the popular Filter Wizard tool. Both of these tools are offered on ADI's Precision Studio platform; click the button below to explore them. I was assigned multiple tasks over the summer; our team's workflow revolved around Agile sprint planning. To avoid revealing any potential trade secrets, design and implementation details in the assignment descriptions below are intentionally vague or absent.
Work Assignments
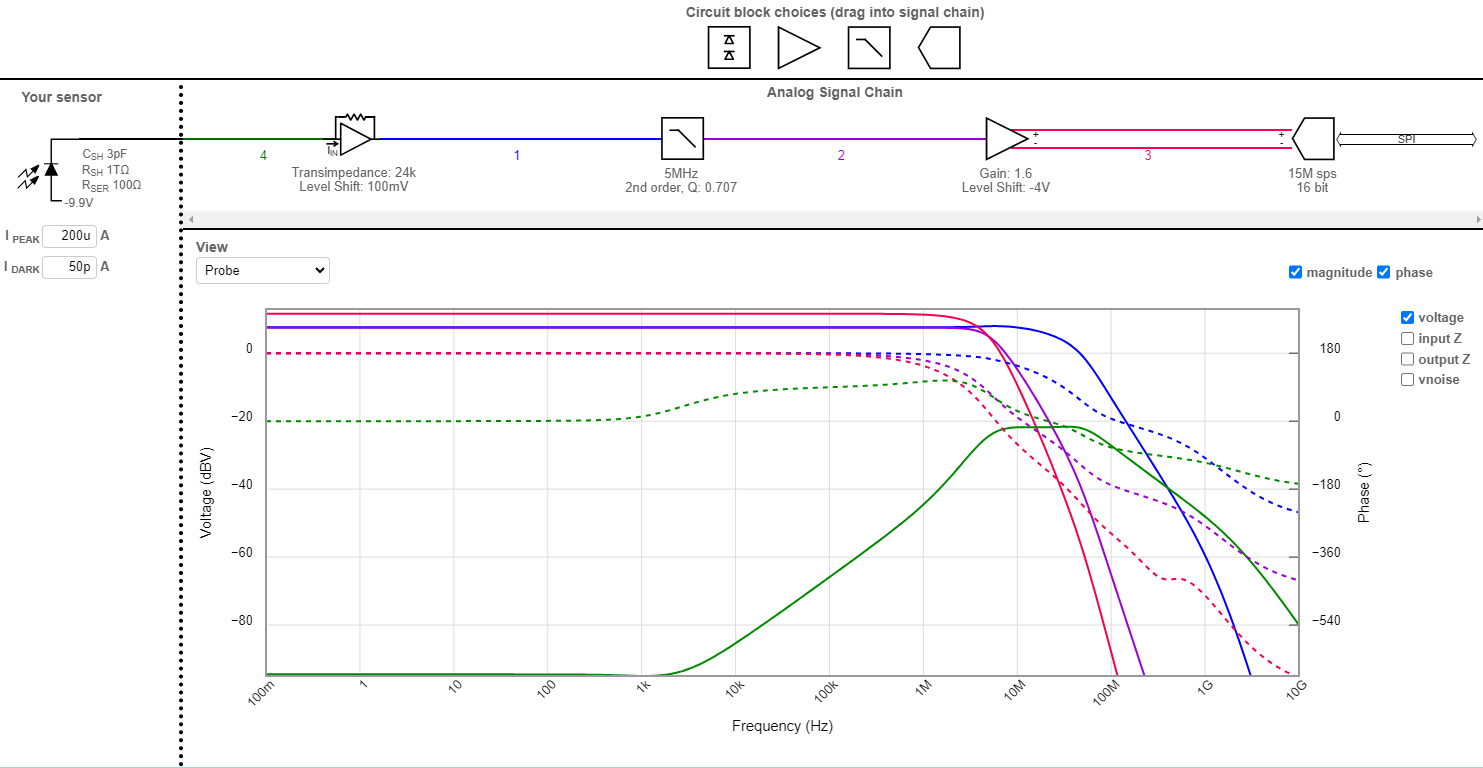
The signal chain design tool (known as the Noise tool) provides a fast, efficient interface for constructing and modeling precision signal chains, all the way from the sensor to ADC. The user can analyze the behavior of the circuit, such as its transfer function and noise characteristics. The tool has a database of datasheet info for various parts which allows the user to swap in their favorite chip and model its performance. The tool also provides a way to export their circuit to LTspice for further analysis.
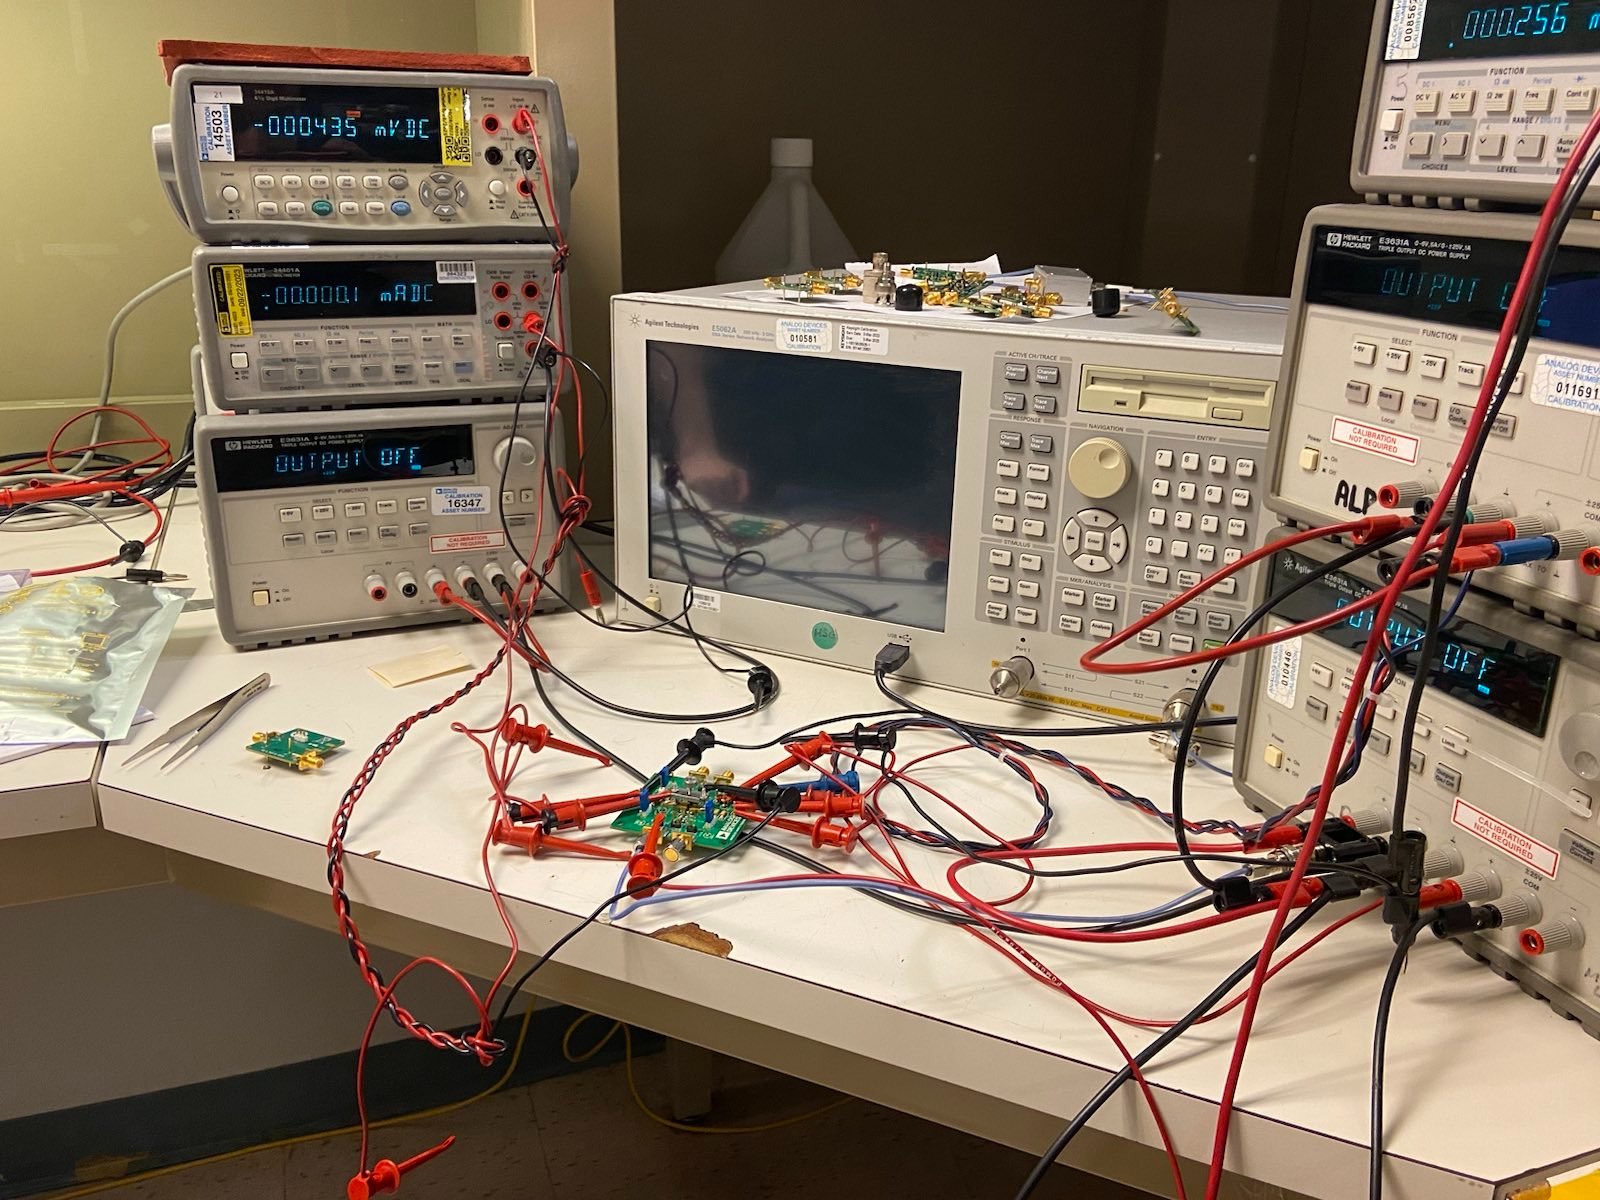
The first big assignment I was given was to complete missing headroom data for some operational amplifiers, differential amplifiers, and instrumentation amplifiers. Good datasheets will provide a plot with either a traditional claw curve - where you see the output headroom you need to avoid satuation for a given load current - or a saturation voltage/output swing curve - where you explicitly see the point at which the amplifier saturates for a given load current or resistance. Our simulation library needs the claw curve data, so it was my job to convert saturation voltage plots to headroom. Most of the work took place in Excel. I digitized points on the saturation voltage plot from the datasheet for a missing part and then upload that data to the part's respective Excel file. Then, I converted the saturation voltage to headroom by subtracting the saturation voltage from the supply rail voltage. Some of the saturation voltage curves were functions of load resistance, so I had to convert the abcissas to load current by dividing the headroom by its corresponding load resistance. There were some other data manipulations I had to perform. In addition, I also improved a script we used for interpolating data between the headroom points by implementing faster search algorithms and fixing edge failure cases. Some datasheets did not provide any type of headroom or signal swing plot, so I helped someone else on the team collect headroom data for a few chips as seen below in the Image Gallery.
The second big assignment I was given involved the display of the Noise tool's dual axis plots. For transfer function and impedance data, we display the magnitude and phase curves on the same plot. However, the phase axis previously used atypical intervals, and the ticks did not align with the gridlines. Since one of the big selling points of the tool is its perspicuous interface, as well as its resemblance to LTspice, the team wanted me to fix the alignment and interval issue with the phase axis. The problem had been placed in the back of the work pile since people had tried fixing it before, for extensive periods of time, but failed. I was able to fix the two issues by designing my own graphing algorithm that both determined the ideal phase interval for a curve and adjusted its axis parameters. The main idea behind the algorithm was to find and compute a logarithmic transform (or linear, where appropriate). Some new issues emerged after my algorithm was introduced. The most interesting problem involved a foundational principle from differential calculus. There is a formal definition of what it means for a function to be differentiable at a point; however, the intuitive understanding of the concept is that a function is considered differentiable at a point if the curve begins to look like a straight line on smaller scales. If you zoom in far enough on an expontential curve or geometric progression, its range no longer spans a decade. Quasi-linear behavior is then observed. Sacrifices had to be made in this case.
The most important assignment I was given revolved around a numerical algorithm known as the Nelder-Mead method. In the Filter Wizard tool, the Nelder-Mead algorithm is used for minimizing an error function. There were a few edge cases where the algorithm produced a simplex that led to incorrect circuit behavior. A few engineers had taken a look at the issue but decided to table it after realizing the problem was not an easy fix. A certain parameter was not being captured, so I had to expand the simplex to a higher dimensional vector space. After ameliorating that issue, I also simplified the logic of the algorithm and improved the convergence tests. The algorithm now produces stable, correct results with a large improvement on the transfer function of certain types of filters.
In the final month of the internship, I was assigned the task of exploring an emerging technology in web development: WebAssembly (WASM). WebAssembly is an assembly language that acts as a compilation target for higher level, non-web-based languages. It allows developers to port previously written software to the web, and it allows current web applications to be optimized by integrating WASM modules that run in the browser with near-native performance. My task was to explore the use of the language in the Noise tool and to devise a method to apply it to an API that the tool uses. Another team at Analog Devices wrote a model for ADCs in C# that runs server-side. Our tool retrieves data from the model through requests over HTTP. My goal was to compile the API to WebAssembly and load it into the browser along with the rest of the application. The existing framework underlying the API, as well as WebAssembly's general lack of stability and support for C#, made the problem difficult. Given the other conflicting priorities I had, such as fixing new problems with the graphing algorithm described above, I was not able to finish implementing a solution. A server-side API can not run client-side unless changes are made to its controller code. I was able to compile the API to a WASM binary and draft some potential ways to integrate it into the larger application. I also brainstormed some ways to optimize other parts of the Noise tool using WebAssembly. However, I ran out of time at the end of the internship to implement those ideas.
Over the course of the internship, I also had the opportunity to meet with people across various sectors of the company. I learned more about patent law, the automotive cabin experience, security challenges in edge computing, and new innovations in digital healthcare. I attended multiple town halls where I had the opportunity to ask the executive team about issues such as the company's exposure to a federal debt default and to sanctions from China in response to the Department of Commerce's export controls. In addition, I had the opportunity to visit locations such as the Garage in downtown Boston and the automotive audio testing hangar.
Image Gallery
 Measurement of headroom claw curve for op amp.
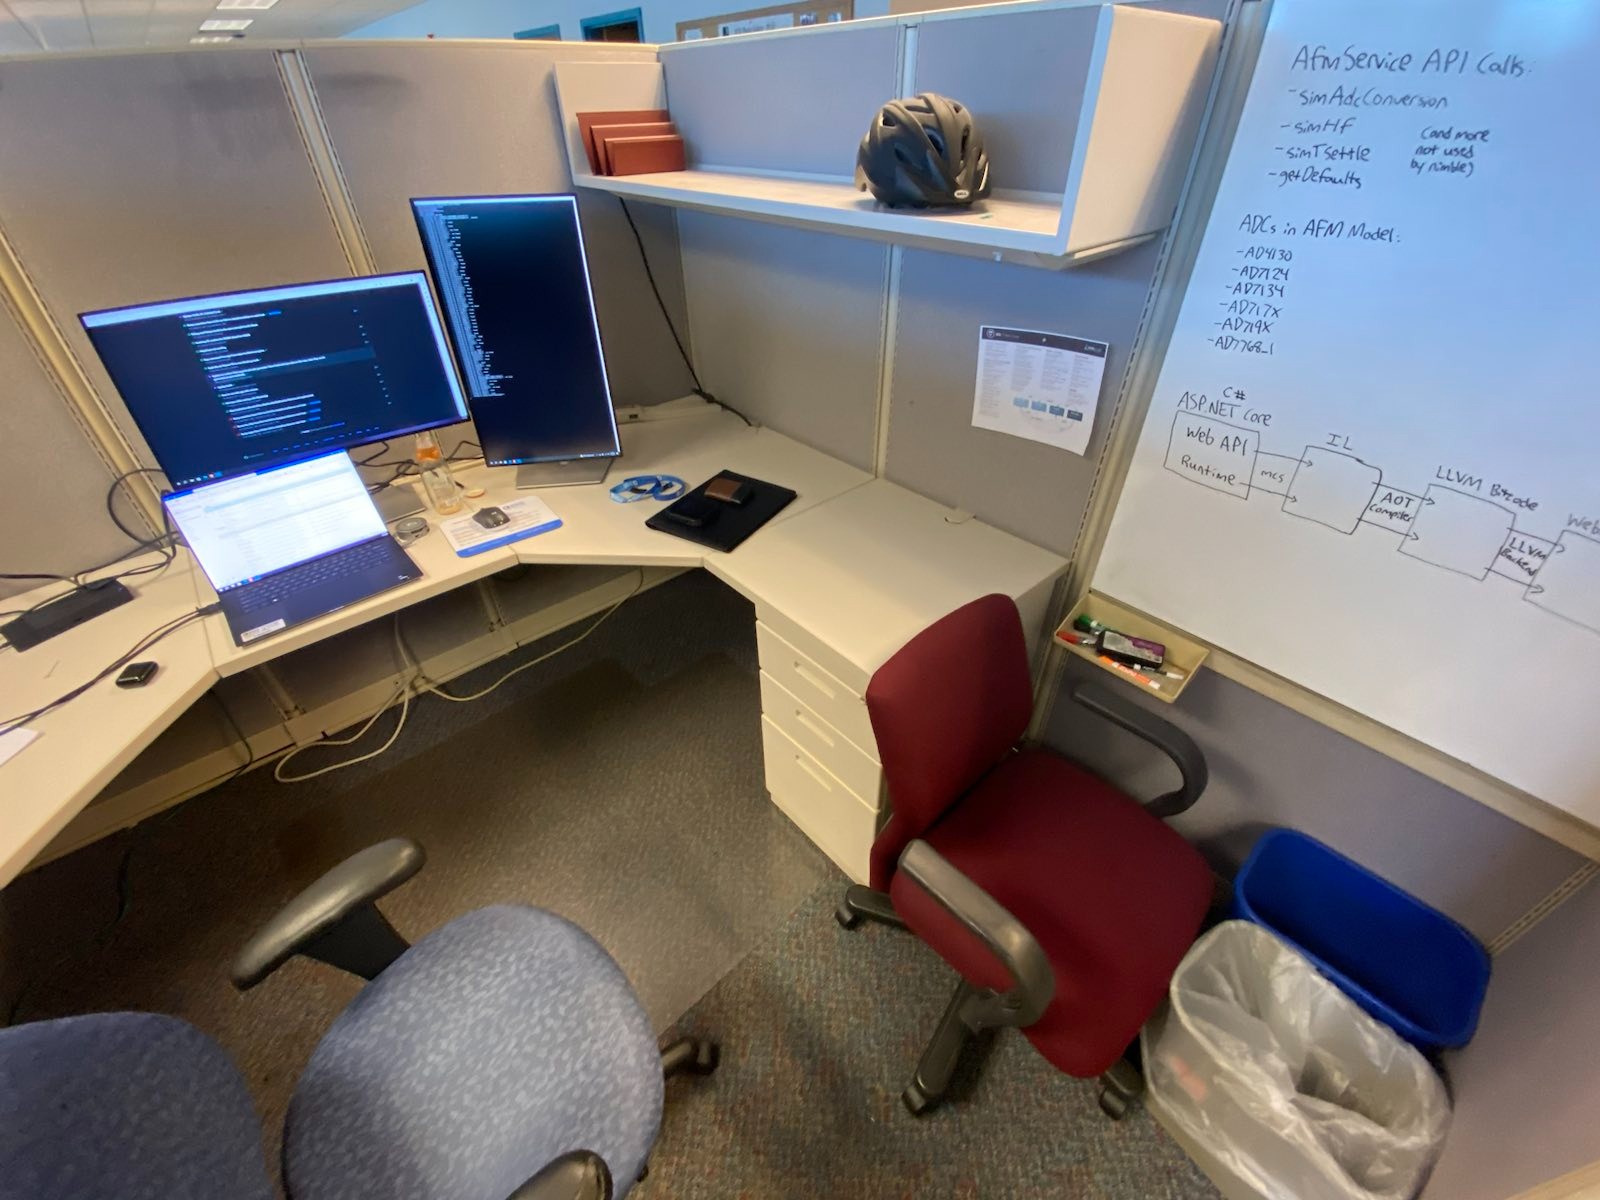
 My cubicle space at the Wilmington HQ
 Transfer Function of a Pulsed Light Signal Chain